- 分享
- 0
- 人气
- 0
- 主题
- 2
- 帖子
- 81
- UID
- 585131
- 积分
- 202
- 阅读权限
- 14
- 注册时间
- 2014-3-13
- 最后登录
- 2018-3-13
- 在线时间
- 276 小时
   
|
Vivocom: to buy or to avoid
Author: Jay | Publish date: Thu, 27 Oct 2016, 07:40 PM
Welcome to another piece of the to buy or to avoid series. Forgive me if I’m a bit rusty as I haven’t blogged for some time. From my last experience with MBSB, please stop here if you can’t take some harsh facts and critical comments on your “previous company”.
Background
Today the company is Vivocom, or formerly known as Instacom. It gained prominence last year due to sharp upwards price movement after it announced the acquisition of Neata, holding company of Vivocom. Thereafter, the acquisition is completed, CIMB initiated coverage with sky-high valuation, proposed placement, proposed change of name, good quarterly results, streams of orderbook announcements, proposed bonus issue etc. Those who are interested of the backstory can go read it up yourself.
My views back then
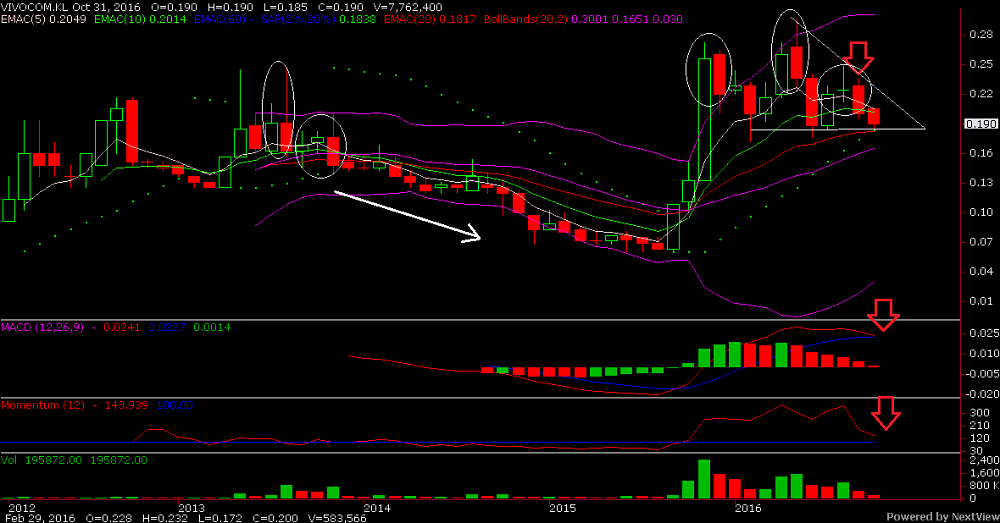
I warned investors in Vivocom (or back then, Instacom) page that it was way overpriced after it shot above 30c. I also highlighted why I though CIMB’s initiation report was pure garbage (I rarely use such strong word) and cannot be relied on. After that, it fell below 25c before going above 30c again. Then, the price started to trend down and after 1 for 4 bonus issue, now it’s at 18c.
So why am I revisiting
Partly because of the mention of small mid-cap in the recent budget and the price has retraced significantly (even after accounting for bonus issue, >35% from its peak). I always try not to be emotional on investments, although I felt it was overvalued back then based on my rough calculations, it could still be a good investment if price has fallen below its fair value.
So on its financials
Orderbook strength
What Vivocom’s supporters often highlight is its strong orderbook. I always hear figures like RM2bn-RM4bn. To be honest, I never really bothered listening. Why? I know Vivocom didn’t win any large infrastructure projects (I do track those) so it’s quite difficult for them to amass orderbook of such size without being awarded such contracts. But now since I’m analysing let’s check out the details.
From Sept 2015 which was the date of circular for the Neata acquisition until today, the contracts awarded are about RM837m. Based on news last year, the MD mentioned they have orderbook around RM400m, which remaining value is around RM300m back then. All these combined, orderbook will be around RM1.1bn before deducting those recognised in 4Q15-2Q16 results. The list is shown below.

Some commencement date are not stated so I just assumed those announced in 2015 will start Jan-16 while those 2016 starts in Jan-17. This is important for projection later.
Wait, I thought it’s much higher?
The fact is, it’s not. Other announcements you saw are Heads of Agreement, Letter of Intent, Joint Collaboration Agreement etc. None of them are legally binding and nothing materialise after initial announcement. For example, in Sept 2016, there’s a HOA for RM600m project in Kinta, Perak.
In it, there’s a term “the Parties are not obligated to proceed with the Proposed Development unless the terms and conditions of a final agreement is agreed upon and executed by 30 Sept 2016, unless further extended by mutual agreement between the Parties”.
Well, there’s no further announcement since then, so in layman’s term, there’s no mutual agreement between the parties and the project is a no go. Same for a few other HOA where there’s a deadline. Some did not, but no further announcement most likely means the project hit road-block or Vivocom was not selected as contractor. Again, the list is shown below.

What about those analysts’ reports?
I did say they were garbage, didn’t I? CIMB initiated coverage back in Nov 2015 and state that Vivocom’s outstanding orderbook was around RM1.8bn when the MD in press conference said was around RM400m. I read through his list in the report, most of them have commencement date in 2016 or 2017 and weren’t announced anywhere. So either he’s a clairvoyant that’s able to see into the future with certainty or he can’t even differentiate between orderbook and tenderbook. The most recent report states that Vivocom’s orderbook stood at RM2.2bn. Other houses also have sky-high orderbook stated in the report, some more than RM3bn.
So who should you trust?
Good question. Trust yourself and no one else. Not even me. I may not have hidden agenda like others but I could make mistake as well. That’s why my approach is always gather info from different sources and try to reconcile them and see if they fit and makes logical sense.
From the list I gathered above, I try to gather against what management said. Back then, circular has about RM350m, MD said RM400m, that’s close. Now I get about RM1.1bn, in the latest quarterly results under prospects, company mentioned similar figures instead of some sky-high figures. Check. What does it mean? Means I will trust my RM1.1bn figure.
And again apply your logic. Trust management and their published quarterly results more than you trust analyst. Because what management said or published, they could incur personal liability if it’s deemed misleading investors. Analysts? Their long winded disclaimer page usually will absolve them of any such liability and for so many years, I have never seen any analyst being taken action against before.
Could there be some omissions?
Yes it’s possible that company may have won some contracts without announcing. That’s why when the difference is between RM350m and RM400m, I gave it a pass. But when it’s RM1.1bn vs RM2.2bn, I just can’t convince myself without sufficient evidence. Besides, again if you look at my list above, company announced contracts with value as low as RM10-20m, do you think the company will not announce contracts that have ballooned their orderbook by RM1bn?
Oh, maybe you omitted those infrastructure projects that CRCC is going to win and subcontract to Vivocom?
If it’s in the future, then it’s not certain and is definitely not in your orderbook. Again look at my lists above (for the umpteenth time J), almost 100% of orderbook as well as those HOAs are related to property development. Which means Vivocom has no track record and most likely no expertise in undertaking infrastructure construction project.
But GeorgeKent was once also a water meter company right?
And of course in Malaysia the bolehland, you can always win contracts without expertise and subcontract it. But first thing first you need to be able to win the contract to subcontract. Vivocom can start winning infrastructure contracts like GeorgeKent if they have directors who are golf buddy with Najib, but last I check, they don’t. So if it’s CRCC winning the contract, will they subcontract to someone who can do the job or subcontract to Vivocom to sub-sub-contract to another party, you be the judge.
Bottom line, Vivocom is just another property development contractor so don’t put your hopes up on some cruel lies brandied around by those analysts.
So what’s the fair value?
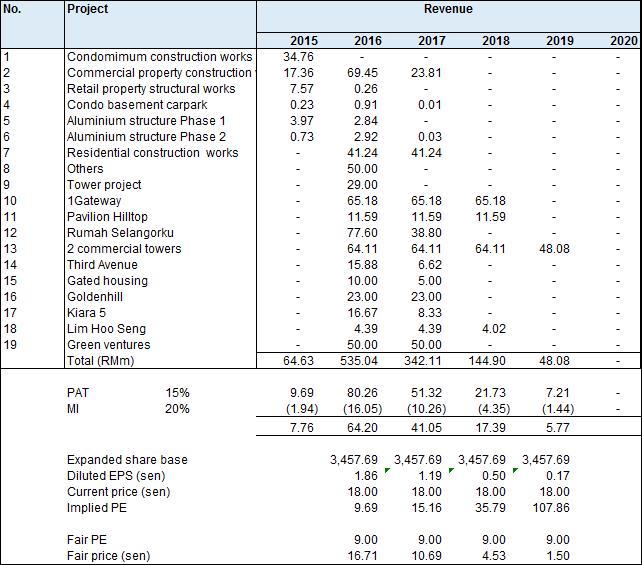
Based on the lists I compiled, verified against other sources, now I can come up with a revenue and profit projection.


If you look under 2016, it does look like the first 2 quarters numbers fit. I used a simple net profit margin assumption of 15%. Usually large construction projects margins are around 6-9%, for Vivocom since it’s smaller scale property development, I give it a higher 15%. Property developers usually earn around 20-25% profit margin so contractors/subcontractors should earn less. For first 2 quarters, average net profit margin was around 19%, I don’t think it’s sustainable and 15% should be fair (as developer will need to earn something as well). Minority interest is applied as don’t forget, Neata that was acquired is a 78.6% owned subsidiary.
What do the numbers tell you?
To sum it up, despite the steep fall, the price is still expensive. The implied PE (blended 2016-2017 around 12.5 times) is high given that it’s a small-cap property contractor. The only good thing is that it has no sales risk like property developer, if not its fair PE should be even lower (given the current property environment).
It also tells you that based on secured contracts, 2017 is going to look like a bad year compared to 2016. To maintain the same revenue and profit level as 2016, they need at least another RM200m sales. Since construction usually lasts around 2 years or more, which means at least another RM400-500m new contracts. Every year to keep revenue above RM500m, they will also need to keep winning close to RM500-600m contracts, which is no mean feat. But that’s the price to pay when you are a RM600m market cap company.
Recommendation
Stay away. Unless the price fall to lower levels or if upcoming contract wins surprises on the upside. |
|


 IP卡
IP卡 狗仔卡
狗仔卡
 发表于 2016-8-31 05:06 PM
 显身卡
显身卡


